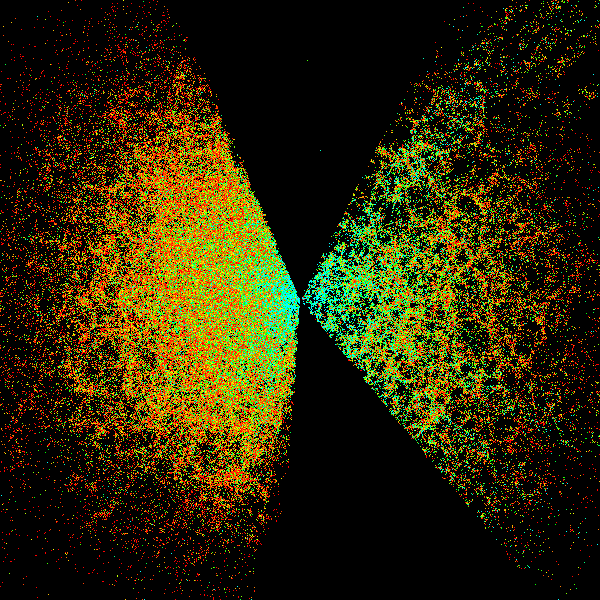

Looking through telescopes the sky looks "flat" - there's little perception of depth. But of course the objects we are seeing are at a huge range of distances from stars in our own galaxy, to exotic beasts called Quasars far out in the very distant Universe.
As we saw in last week's lab the distance to objects can be determined by measuring the redshift of their light reaching us. This gives us the third dimension. A huge project is underway to map the 3D structure of the Universe called the Sloan digital Sky Survey (SDSS). The University of Chicago plays a big part in this effort.
Although huge compared to other surveys the Sloan is only covering some strips taken from the full sky resulting in "fan" shaped regions of coverage extending out from the Earth. The image below shows the measured positions of galaxies as point in 3D space - click on it to see it animated - spinning and zooming in and out. During this lab session your TA will show you a special 3D projection of this same data, and you will be able to "fly" through it yourselves.
 .
.
The SDSS measured the distance (redshift) for all objects brighter than a cutoff brightness. So it's easy to see that faint objects will get measured if they are close to us, and brighter ones will get picked up both close and further away. That's why the density of points in the image above tails off going further out. The stragglers are very luminous galaxies out around 500 Mpc from Earth - around 1.5 billion light years from Earth, or a redshift of around 0.2. So powerful though the SDSS is it still gives us a biased view of the structure which is actually out there.
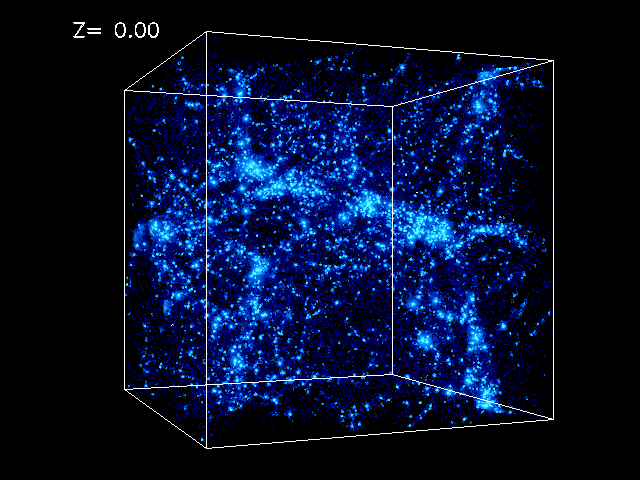
Compare the image above to the simulation below - click in the image to play. Here we are seeing a massive computer simulation of structure forming as the Universe evolves. To start with it is the almost featureless primordial soup coming from the era of the CMB. The number in the corner is the redshift counting down - getting closer and closer to the present. We can see the Universe becoming progressively more "lumpy". The scale of the box is about a tenth as big as the plot of SDSS data above - the smallest dots we are see at the end of the simulation correspond to galaxies in the real Universe today.
 .
.
Now we are going to look at some data from the SDSS ourselves. The data are all available on the web through the Skyserver. A nice visual interface is provided - open the Navigator in a new window. Just like Mapquest or similar we can zoom in and out and pan around. We can also click on an object and see info about it at top right and a zoomed in view at lower right. By clicking the options at lower left we can turn on and off displays of various things - turn on "Grid", and "SpecObjs". Now objects for which the redshift was measured appear in red boxes.
At upper right we can re-center the display to a given position on the sky by typing in the ra and dec. Enter ra=2, dec=1, and click "Get Image". We can see several galaxies of different colors and shapes. Now zoom out by three steps so that the scale bar shows 5'. This means 5 arc minutes or one twelfth of a degree. The moon is about half a degree across so the image is about the size of the full moon.
Play around with clicking on objects to identify them. What are the brightest objects in the image? Why do you think they were mostly not selected to have their redshifts measured? The ugriz numbers at upper right are magnitudes - a funny measurement of brightness that astronomers use. Smaller numbers are brighter, and each increase of one in the magnitude corresponds to a factor 2.5 decrease in brightness. Only galaxies with r magnitude (red band) of less than 17.8 were selected to have their redshift measured by SDSS.
Click on each red boxed object. Be careful to center the zoom exactly on the object you want or the information at upper right may not refer to what you think it does. For each galaxy with r less than 17.8 (most of them) click the "Add to Notes" button. Repeat for all the red boxed objects in the image. Finally click "Show notes" to see a list of all the objects you selected. Make sure there are no stars in the list or galaxies with r greater than 17.8. Copy the ra and dec coordinates of each galaxy into a spreadsheet.
For each object in the list click "Explore" - you will see a whole bunch of detailed information. Half way down the page below where it says "SpecObjId" the redshift "z" is given. Add this to your spreadsheet for each galaxy also.
What shape in 3D space does the square image in the navigator window correspond to? Given that a redshifts of 0.1 corresponds to a line of sight distance of 400 mega parsecs use redshift z to calculate the line of sight distance to each galaxy in your list. Further given that 1 degree of angle corresponds to a transverse distance of 7 mega parsecs at 400 mega parsecs out use ra and z to calculate an x coordinate for each of your galaxies. Now plot an x-y scatter graph of los distance versus transverse position for your galaxy sample.
Using the numbers in the previous paragraph estimate the volume of space your list of galaxies are sitting in. Hence estimate the density of galaxies in units of galaxies per mega parsec cubed.
To actually calculate the total mass of the galaxies in a survey like SDSS we have to do a much more sophisticated calculation than the one above. What is the most obvious reason for that?